Hi guys,
I’m part of a group of italian citizen interested in environment and environmental measurements.
We start a project with the local Environment Agency (ARPA) and we are exploring the possibilities of analyzing and visualizing sensor data together with them.
At the moment we are promoting the installation of Luftdaten sensors, but we are open to every solution.
We saw here (https://community.hiveeyes.org/t/querying-our-influxdb-databases-interactively/1372) the possibility to use the InfluxDB and grafana for customize the visualition of the data, and we would really love to have this acces to start testing these features.
Hope to have a good collaboration with all the team
Dear @centralinedalbasso,
thanks for writing in and for the interest in the things we are doing here. Welcome to our community!
First of all, we would like to tell you we are just downstream users of luftdaten.info and do some data ingesting and processing by consuming their API.
Our main workhorse here is
which is operating on the API of luftdaten.info in bulk-/batch-mode.
We are looking forward to support your community with things around that. @cripcrip just joined us and asked about related things at Missing data of my luftdaten.info sensor with LDI station id 19604 from Veglie, Italy on the Grafana map, so we are humbly asking whether both of you are actually coming to us from the same community?
Feel free to ask further questions about the Luftdatenpumpe program and our infrastructure how we could support your endeavors. Would you like to get access to your data through the dashboards we are providing to the community or are you actually interested to operate the whole downstream infrastructure on your own behalf?
With kind regards,
Andreas.
Dear Andreas,
yes we are in contact with @cripcrip, and looking for some useful solution to better visualize the luftdaten data.
We saw some grafana dashboard, but we would like to personalize it a bit more.
For that purpose, we look to the possibility to operate directly on the InfluxDB data to create our own dashboard.
For the project with arpa that is starting in this month could be very useful make a full analysis of the data from lufdaten without the necessity to download it from their CSV.
hope this clarify our necessity
if not, feel free to ask more.
regards
martino
Dear Martino,
thanks for telling us more details about your goals.
Unfortunately, we are not able to permit direct access to the InfluxDB databases we are operating on our servers to a wider audience in order to keep tight control over the system load eventual queries might be doing there. The thing we have been talking about on https://community.hiveeyes.org/t/querying-our-influxdb-databases-interactively/1372 is really just meant for providing direct access to our databases within the relatively small beekeeper community around Hiveeyes.
However, the https://github.com/panodata/luftdatenpumpe program might help you significantly in order that you don’t have to get into parsing the CSV files on your own behalf. Its machinery is pretty mature and is being used to drive parts of our infrastructure around processing and visualizing air quality information.
These days, Luftdatenpumpe is also being used elsewhere – see also Supporting the Flanders Environment Agency (VMM) by analyzing and visualizing air quality sensor data with InfluxDB and Grafana. In order to have a look at what we already have been doing for VMM, you might want to have a look at https://vmm.panodata.net/, which might well resonate with you.
Saying this, we will be happy to support you spreading the word and reusing parts of our infrastructure to provide the things we are doing to a wider audience in general. So, we are happy that you approached us about these details and look forward to hear anything what comes to your mind about this.
With kind regards,
Andreas.
Thank you for the explanation.
So we need a server where install a local instance of luftdaten pumpe, correct?
The work done for the VMM is available?
cheers,
martino
All things we are doing are mostly completely open source. For everything missing, it’s just a matter of lack of time and resources if they’re not. Most essential stuff should be available from within the Luftdatenpumpe project repository. However, some of the advanced dashboards seen on https://vmm.panodata.net/ are hand-made and only available within this specific Grafana environment. Please let us know if you would like to get blueprints of the dashboard sources in order to be able to replicate them and reuse within your own Grafana environment.
This would be one possible way in order to operate completely in autonomous mode. However, you will also have to invest significant time and resources to get everything ramped up on yet another machine, depending on the personal know how and persistence of yourself or people around you.
Please be prepared that this will probably take a few hours even with solid knowledge of building such systems. In general, we would be happy to see people replicate our work on their own premises, but we also might consider alternatives to that.
Saying this, there might also be easier ways. We might think abou providing you with a playground environment / an account on one of our Grafana instances where you could play with the data within your own dashboards. They could be derived from our dashboards in order to get you a softer kickstart.
Hi there,
after fixing things over at Missing data of my luftdaten.info sensor in Veglie, Italy on the Grafana map, we also added a map display focused to Italy at https://weather.hiveeyes.org/grafana/d/ZKf6O2TWk/luftdaten-info-map-for-italy. Enjoy!
With kind regards,
Andreas.
Dear Andreas,
That will be great!
As you say for a softer start.
I see the link for the maps. Thank you.
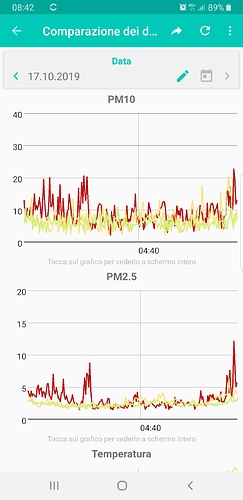
Our focus is on realizing simple kpi to check the values among different station at the same time, something like the file attached.
But not only for the actual day…
The work of vmm is very similar to what we would like to realize.
Best
Martino
Hi there!
as a short introduction: Together with @Andreas.Motl I am working on the VMM-luftdaten.info-project, especially on creating dashboards/visualizitions and tinkering with humidity-correction formulas.
That goal makes me curious (the file wasn’t attached!). How would these performance-indicators work? Would they focus on “getting enough measurements per time” or more on “is one station of a group of neighbouring stations far off, compared to the group”?
Sorry, I forgot the image.
Is from the app for android particulate matter that provides a very simple, but not editable, visualization for multiple sensors.
The focus will be on analyze the deviation, your second options.
Any suggestion and help will be very appreciated.
Dear @centralinedalbasso,
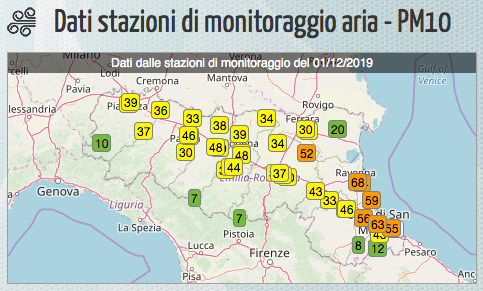
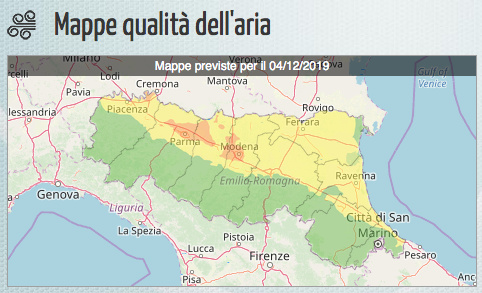
these are the canonical links to your organization Arpae Emilia-Romagna, right?
With kind regards,
Andreas.
Yes, correct!
And this is the link for the air section:
https://www.arpae.it/index.asp?idlivello=134


