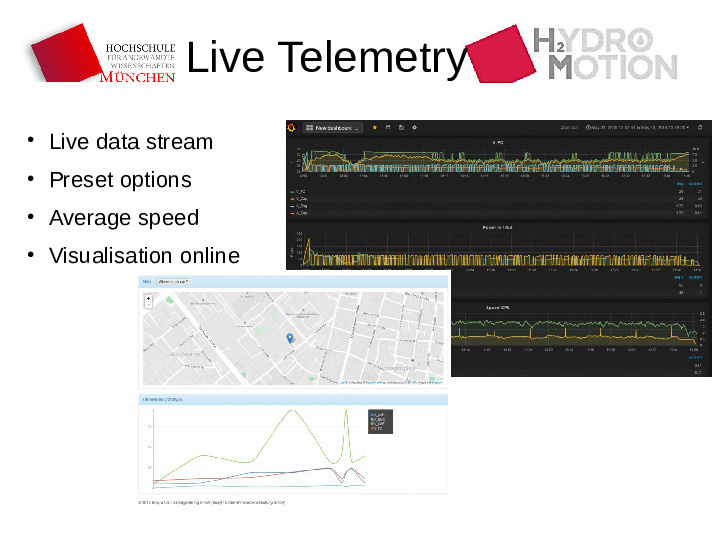
Live telemetry for Hydro2Motion
Our systems powered the telemetry platform for the Hydro2Motion team at the “Shell Eco-marathon europe 2015” in Rotterdam. The vehicle from Labor für Systemtechnik at the Munich University of Applied Sciences is powered by a hydrogen fuel cell.

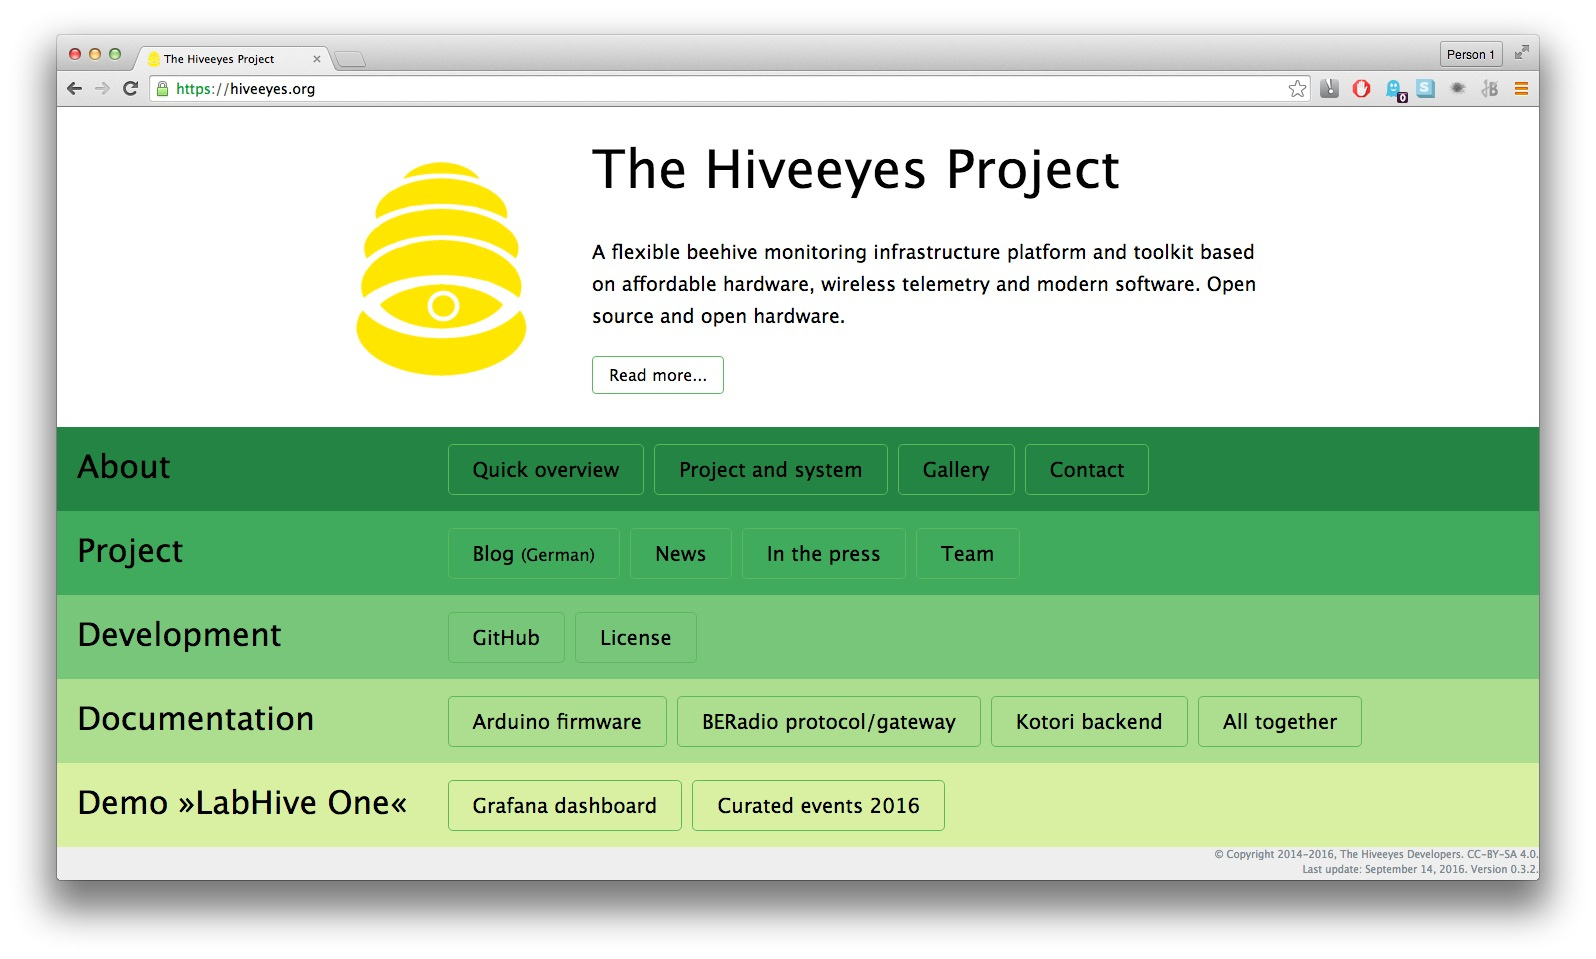
Data acquisition and processing infrastructure for the Hiveeyes Project
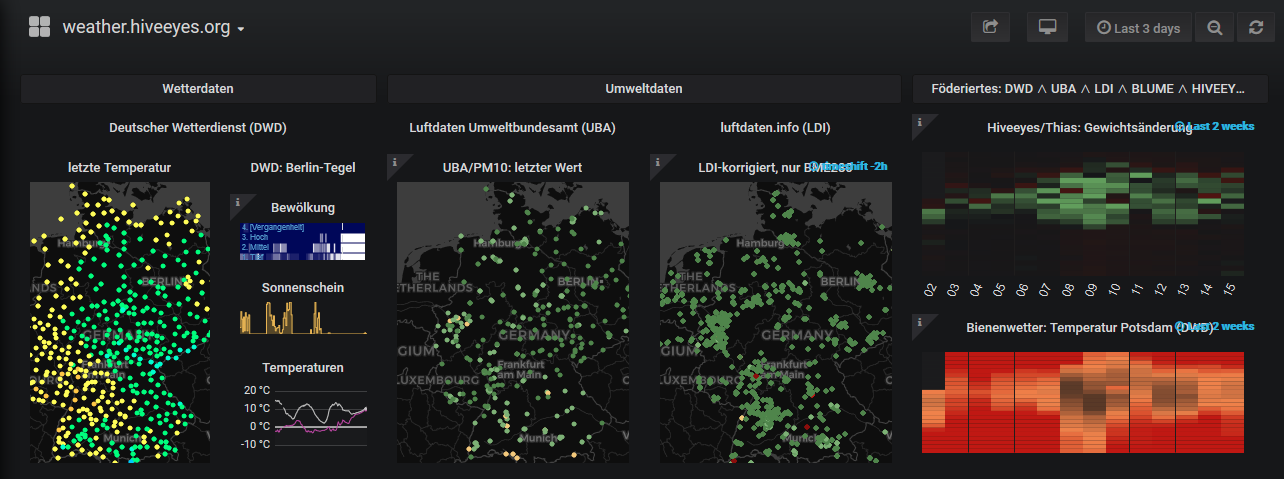
The Hiveeyes Project develops a flexible beehive monitoring infrastructure platform and toolkit based on affordable hardware, wireless telemetry and modern software. Open source, open hardware and a friendly community.
Together with Mosquitto, InfluxDB, Grafana, mqttwarn and BERadio, Kotori powers the Hiveeyes system on swarm.hiveeyes.org as a data hub for a collective of beekeepers from Europe and beyond.


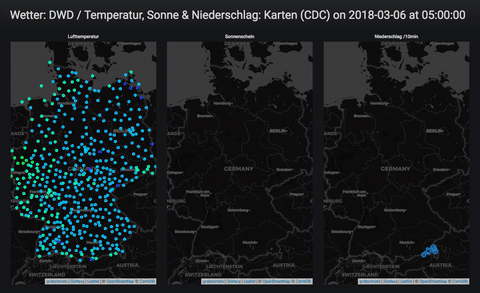
DWD import and visualization
We are ingesting data from the German Weather Service (DWD) and putting some sensible visualizations on top.
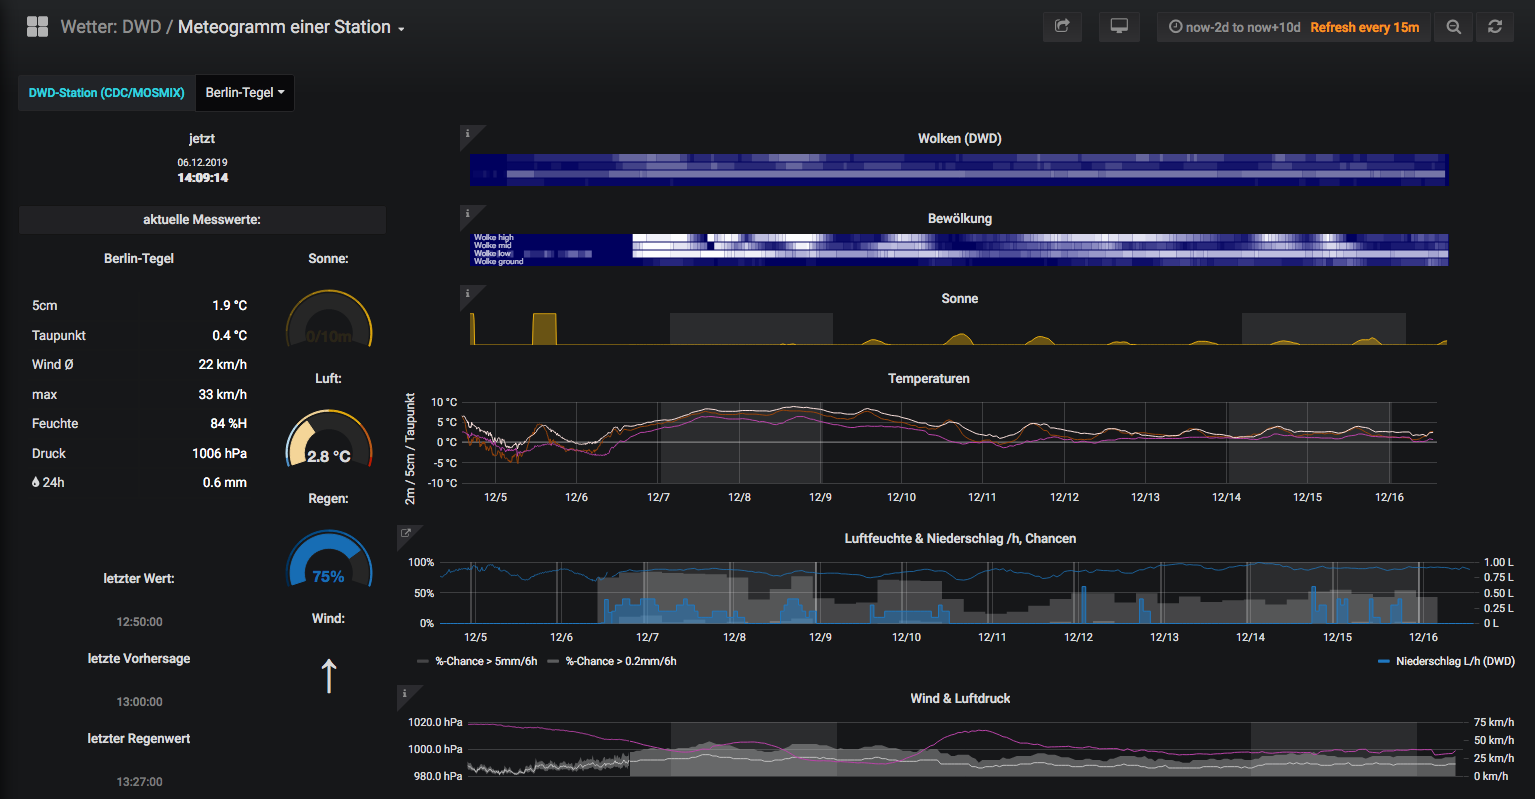
– Wetter: DWD / Meteogramm einer Station
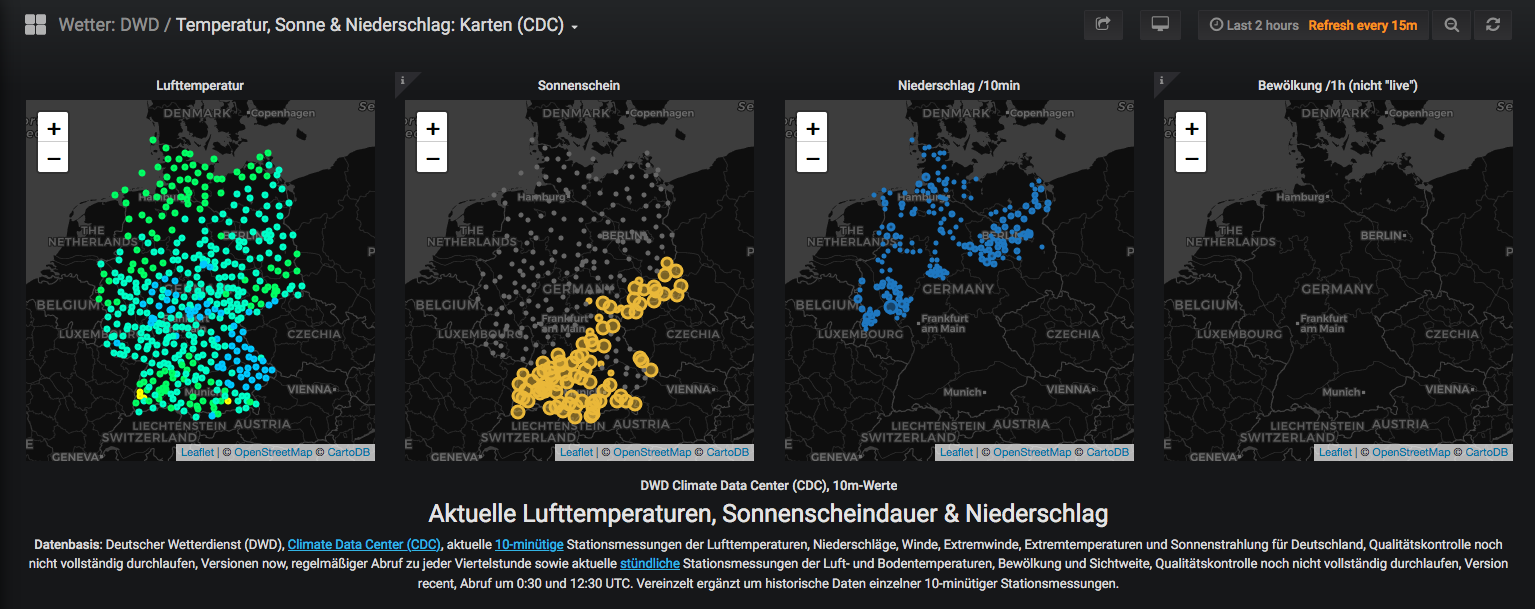
– Wetter: DWD / Temperatur, Sonne & Niederschlag: Karten (CDC)
Acknowledgement by Grafana Labs
We felt honored that work from our pen has been picked by the folks of Grafana Labs to be presented within their curated list of Public Grafana Dashboards Worth a Look. Thanks, Julie!
.
Air quality monitoring for the Flanders Environment Agency in Belgium
We had the pleasure that people of VMM asked us to support their work for the Belgian Interregional Environment Agency (IRCEL - CELINE) on air quality monitoring within the EU-funded Corona EU and VAQUUMS projects.
-
More details about this joint venture project.
Supporting the Flanders Environment Agency (VMM) by analyzing and visualizing air quality sensor data with InfluxDB and Grafana -
The staging system. Sorry that some dashboards might currently be broken there.
https://vmm.panodata.net/
Presentation at the Geospatial Sensing Conference (GSC2019) in Münster
We are happy to have been invited to talk about the things we are doing around environmental data collection, processing and visualization within the lightning talks section of a GIS-related conference a few weeks ago. The audience was all ears about the capabilities of InfluxDB and Grafana.
-
More information about the talk.
Talking about the Hiveeyes project and some Panodata technologies at the 5th Geospatial Sensor Web Conference in Münster, 3. September 2019 -
The presentation slides.
Fancy synthesizing of bee-, weather- and environmental-data with Grafana and InfluxDB
Air quality monitoring for the “arpae” environment agency in Emilia-Romagna, Italy
Folks working together with arpae – the regional agency for prevention, environment and energy of Emilia-Romagna (Italy) – asked us to support them rendering air quality maps from luftdaten.info sensors with a focus on specific geographic regions within Italy.
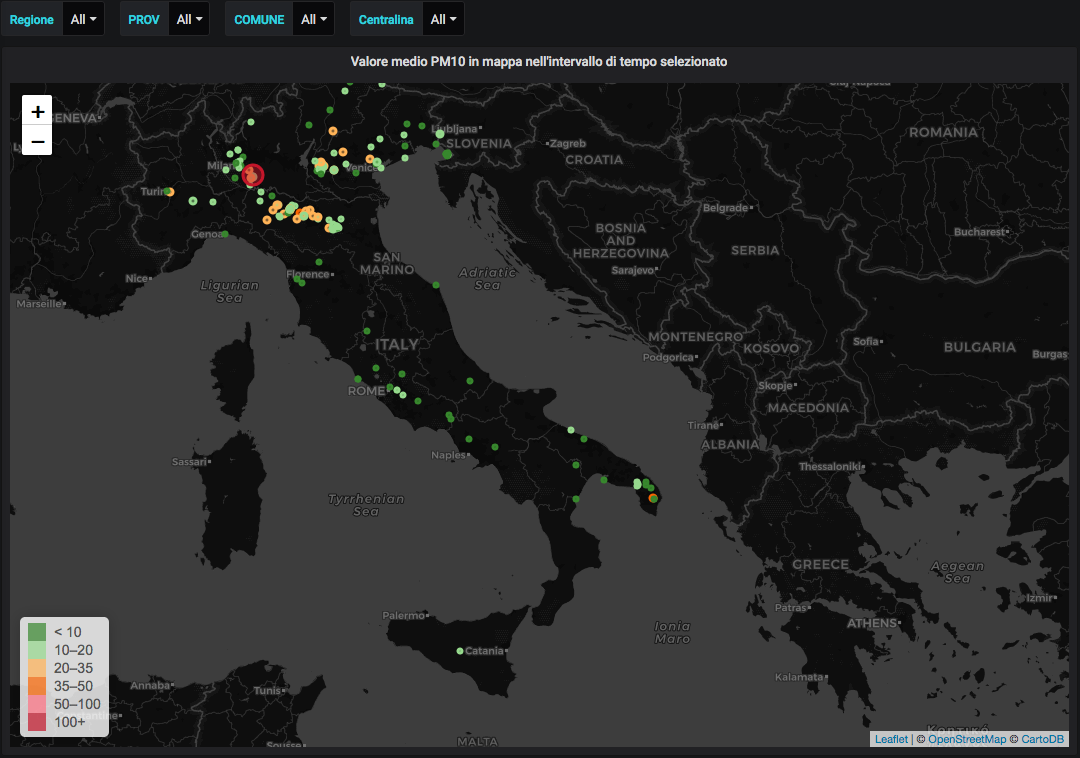
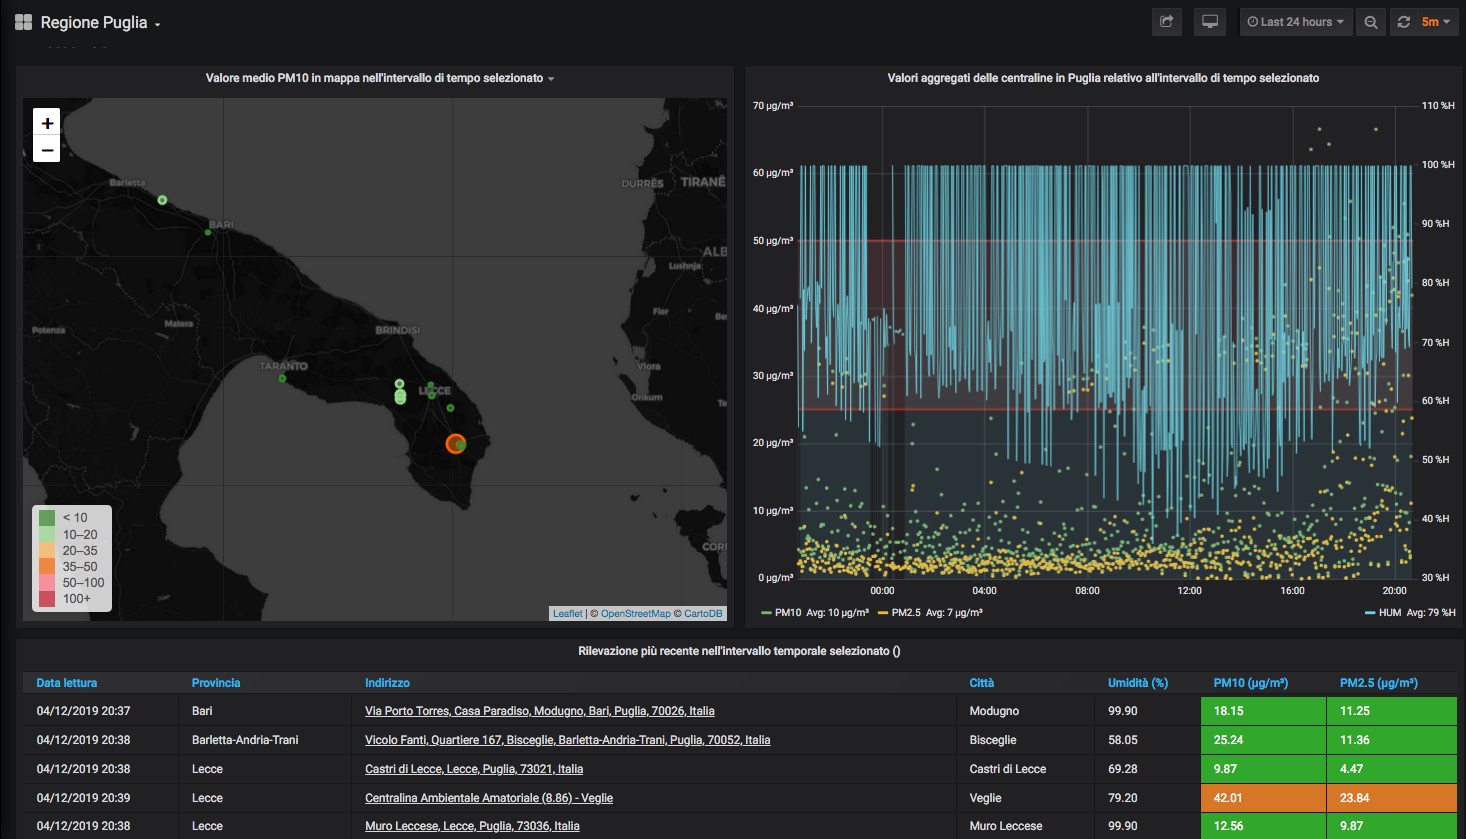
– Left: Italy, Right: Puglia, Italy
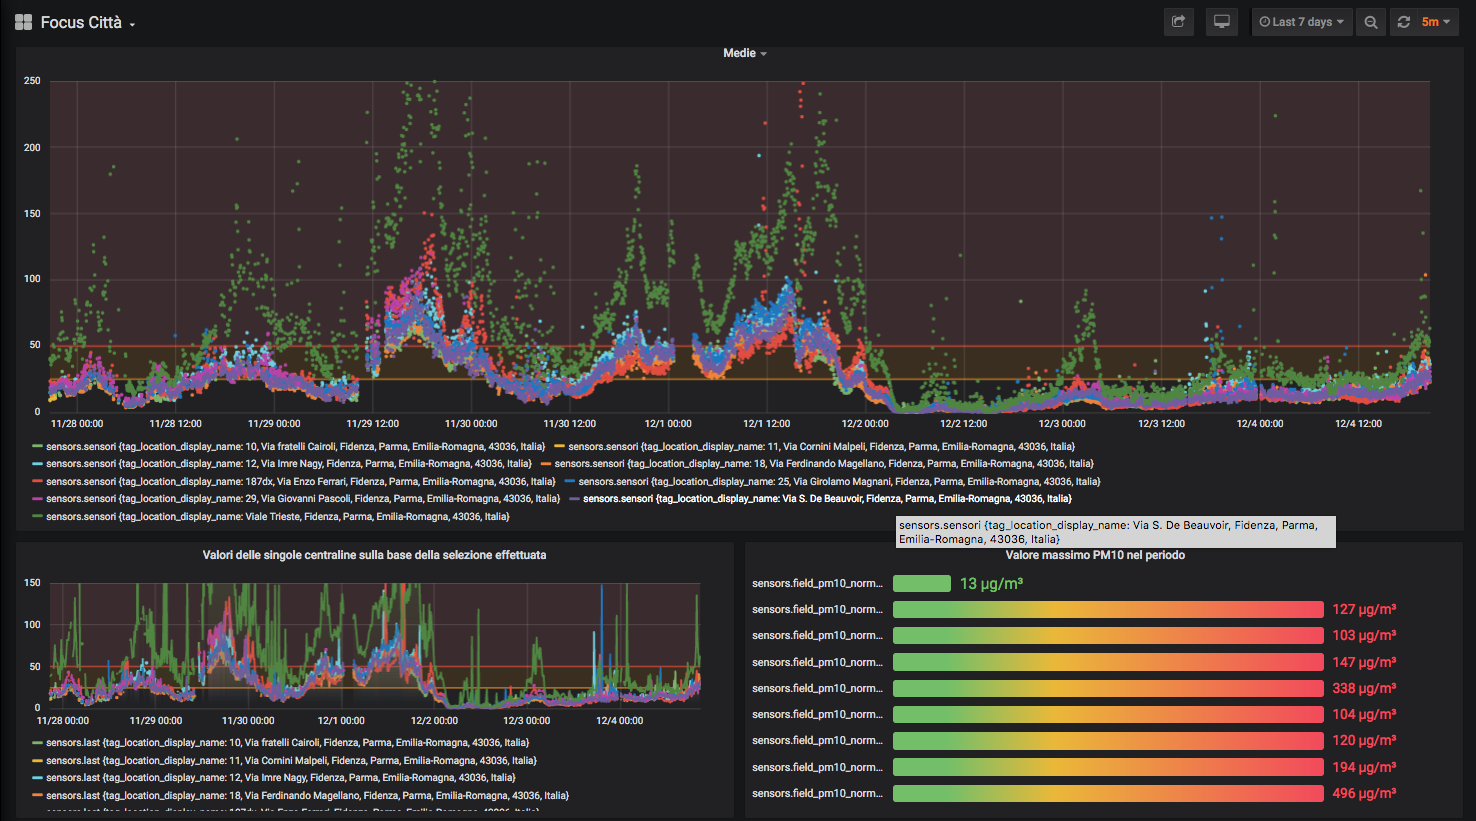
– Città, Italy
NSIDC Sea Ice Index
Data from the National Snow and Ice Data Center (NSIDC) is ingested and visualized.
- Details: Ausmaß der nord- und südpolaren Eiskappen seit 1979 in InfluxDB/Grafana - Umweltdaten - Hiveeyes
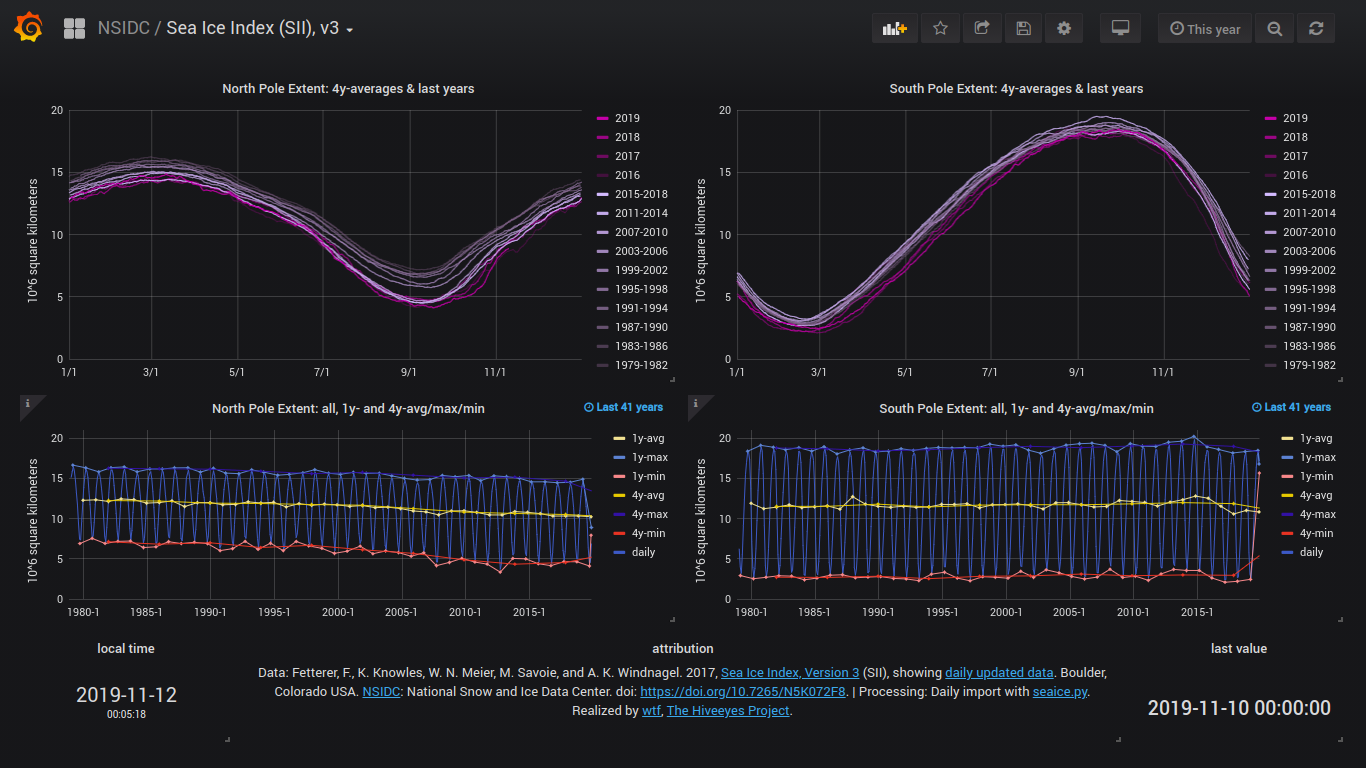
– NSIDC / Sea Ice Index (SII), v3