Introduction
We are building reliable tools for acquiring, processing and visualizing sensor data – ready for production.
Data acquisition and processing
Kotori
Kotori is a multi-channel, multi-protocol data acquisition and graphing toolkit based on Grafana, InfluxDB, Mosquitto and Twisted. It is written in Python.
- Documentation: https://getkotori.org/
- Repository: GitHub - daq-tools/kotori: A flexible data historian based on InfluxDB, Grafana, MQTT and more. Free, open, simple.
Terkin-Datalogger
Terkin is a powerful datalogger for Pycom devices and other boards running MicroPython.
- Repository: GitHub - hiveeyes/terkin-datalogger: Terkin-Datalogger for MicroPython - data logging for humans
Luftdatenpumpe
»Luftdatenpumpe« is a toolkit for efficiently processing air particulate data from open data sources.
Luftdatenpumpe currently processes live and historical data from luftdaten.info and the IRCELINE network. It can filter by station-id, sensor-id and sensor-type, and apply reverse geocoding in the data transformation steps. After processing, the software will store measurement data into timeseries and RDBMS databases (InfluxDB and PostGIS) and can optionally publish data to MQTT or just output as JSON.
- About: Luftdatenpumpe
- Repository: GitHub - panodata/luftdatenpumpe: Process live and historical data from luftdaten.info and IRCELINE. Filter by station-id, sensor-id and sensor-type, apply reverse geocoding, store into timeseries and RDBMS databases, publish to MQTT, output as JSON or visualize in Grafana.
mqttwarn
mqttwarn subscribes to any number of MQTT topics and publishes received payloads to one or more notification services after optionally applying sophisticated transformations.
It comes with over 70 notification handler plugins for a wide range of notification services and is very open to further contributions. You can enjoy the alphabetical list of plugins within the handbook.
We supported the authors of mqttwarn bringing their code base up to speed with respect to packaging, testing and migration to Python 3.
- Repository: GitHub - jpmens/mqttwarn: Subscribe to MQTT topics (with wildcards) and notifiy pluggable services
Data visualization
Grafana Map Panel
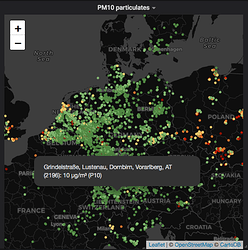
Grafana Map Panel with improved convenience, robustness and features. It builds upon the Worldmap Panel plugin for Grafana | Grafana Labs, integrates different contributions coming from the community and continues adding dearly requested features while focusing on robustness and stability.
- About: Grafana Map Panel
- Repository: GitHub - panodata/grafana-map-panel: Grafana Map Panel with improved convenience, robustness and features
– Source: luftdaten.info Karte Deutschland
grafanimate
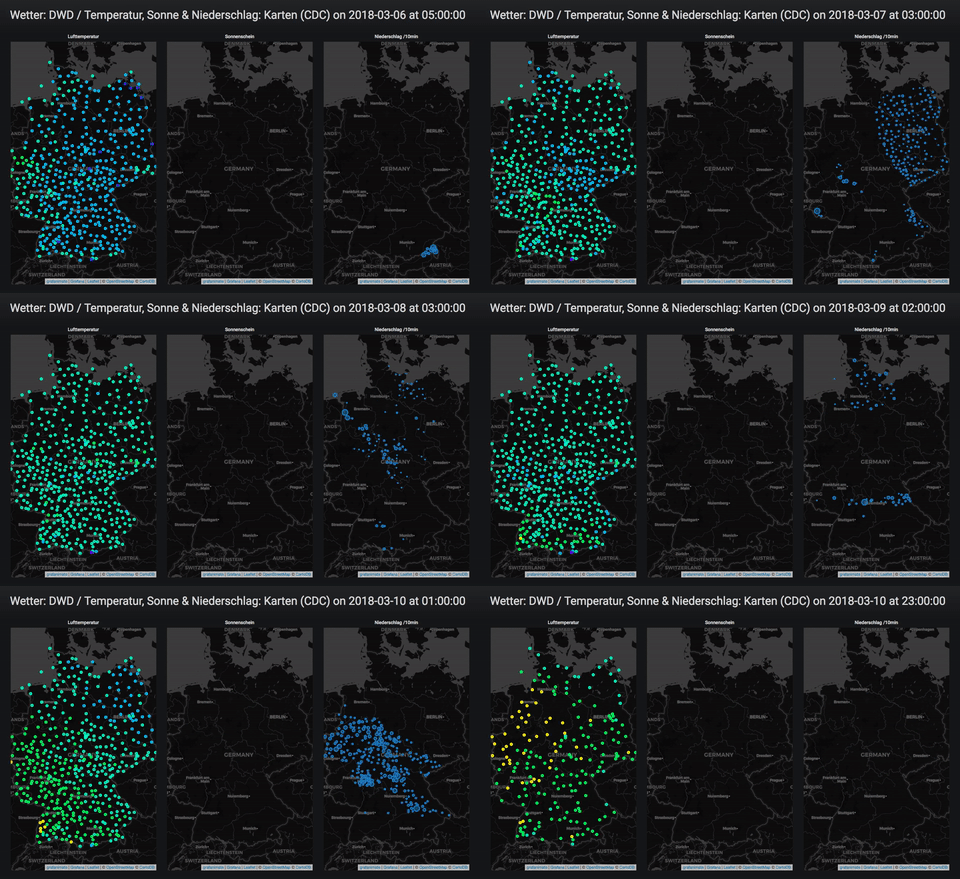
»grafanimate« captures screenshots while animating a Grafana dashboard by manipulating its time range control, i.e. navigating through time. The result can be rendered as a sequence of png images, an animated gif file and as a video file.
- Repository: GitHub - panodata/grafanimate: Animate timeseries data with Grafana
- Examples:

grafana-wtf
grafana-wtf greps through all Grafana entities in the spirit of git-wtf. and can also invoke replacement actions on dashboard contents. It helps while maintaining large installations of Grafana.
