Hi there,
a colleague just reported an anomaly on the “generic trend” dashboard we are still hosting over at swarm.hiveeyes.org – thank you! When you click on the P2.5 or P10 series at [1], you will see that it appears like there are multiple time series for the same station.
While we feared that there would be something wrong with the data processing pipeline, you can see that everything is just fine on the new dashboard over at [2].
So, we should probably phase out the old dashboard and swap in a redirect pointing to the designated one at grafana.panodata.net. The new one is even better because it also includes weather information, thanks to @wtf.
With kind regards,
Andreas.
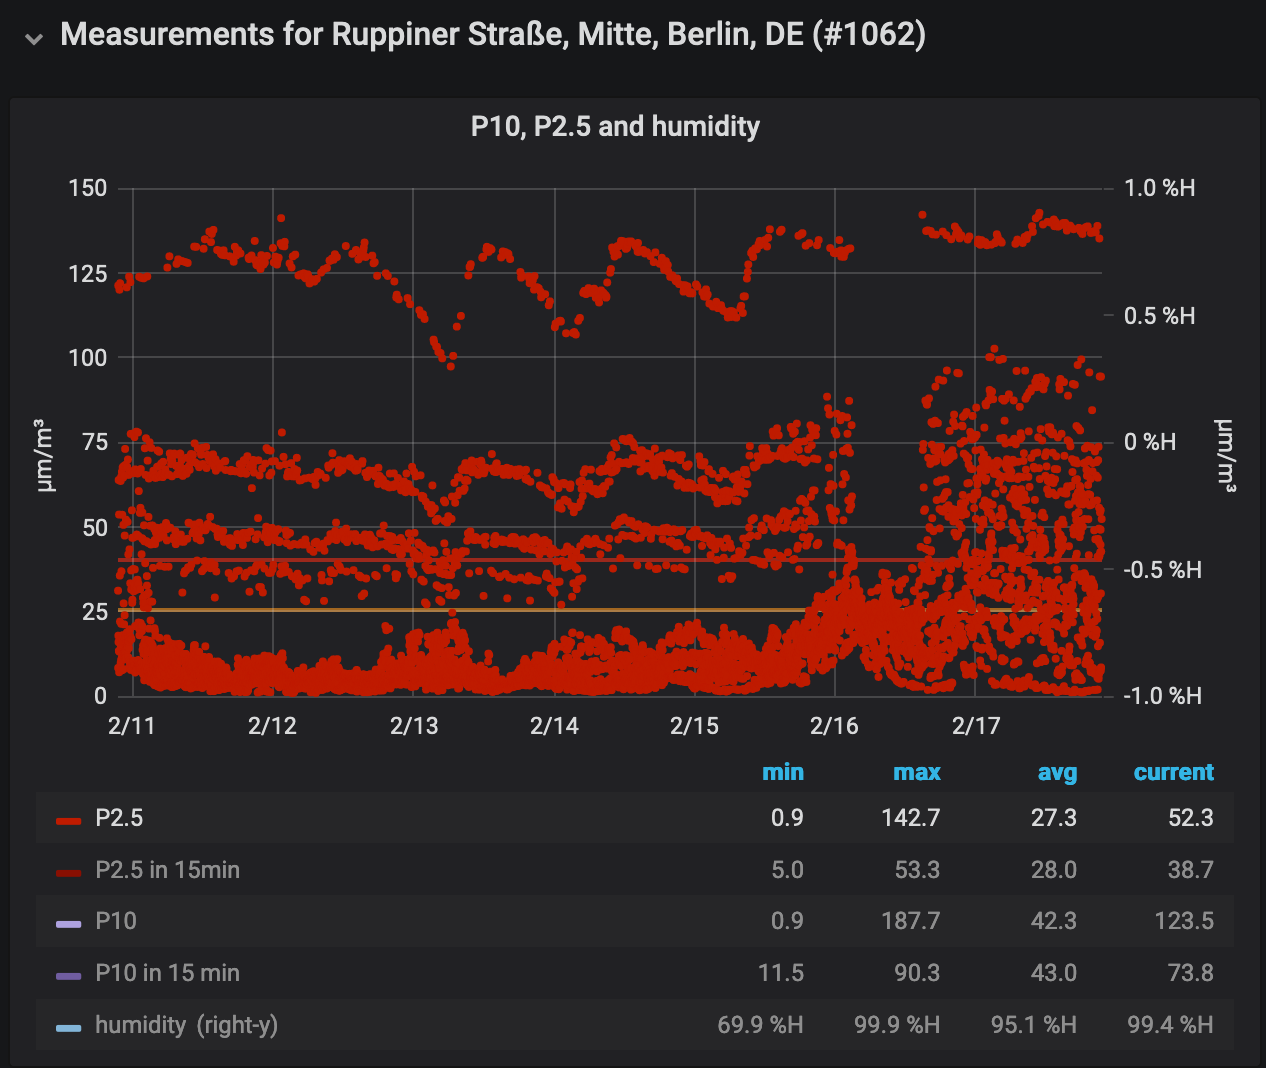
[1] Luftdaten » luftdaten.info Verlauf Original » Measurements for Ruppiner Straße, Mitte, Berlin, DE (#1062)
[2] Luft: LDI » luftdaten.info generic trend » Measurements for Ruppiner Straße, Mitte, Berlin, DE (#1062)