Introduction
This topic is about educating users about how to adjust their web browser settings that data panels embedded through iframes on foreign pages will show up again. This is related to relevant security settings of the web browsers in use. We will shed some light on this by using the Firefox browser as an example.
Background
At Air quality information for Sheffield (GB), @Rohitc gave us a heads-up that some users of https://sheffieldair.co.uk/ reported that the embedded panels would not load on their web browsers.
Observations
Instead of seeing those beauties, users will see a message like
If you're seeing this Grafana has failed to load its application files

1. This could be caused by your reverse proxy settings.
2. If you host grafana under subpath make sure your grafana.ini root_url setting includes subpath
3. If you have a local dev build make sure you build frontend using: yarn start, yarn start:hot, or yarn build
4. Sometimes restarting grafana-server can help
Web browser privacy & security settings
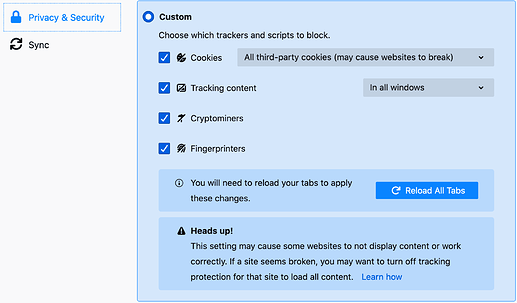
This will happen if the user chose to apply very strict security settings for cookies, like blocking all third-party cookies or blocking all cookies completely.
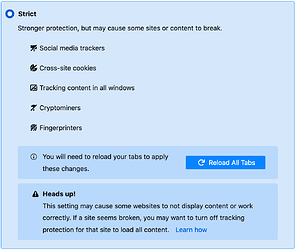
As a side note, it will apparently not happen when using the default “Strict” option as of Firefox 86.
Verification
You can verify if this is happening to you by checking the “Enhanced Tracking Protection” status by clicking on the shield icon next to the URL you are currently visiting. If your web browser is blocking cookies from a specific site, it will be listed within the “Third-Party Cookies Blocked” sub-dialog.
Mitigation
Don’t worry about loosing protection, you will not have to relax your general security policy settings and still be able to enjoy embedded panels by individually opting out of tracking protections for specific sites you are visiting.
In order to do so, just flip this switch within the “Enhanced Tracking Protection” dialog.


